ScopeLab.app
Bench instruments have never been short of measurement power. Getting it out of them is the problem. You end up squinting at a 7-inch LCD, photographing it for a report, or discovering that the measurement you need is a licence you didn't buy.
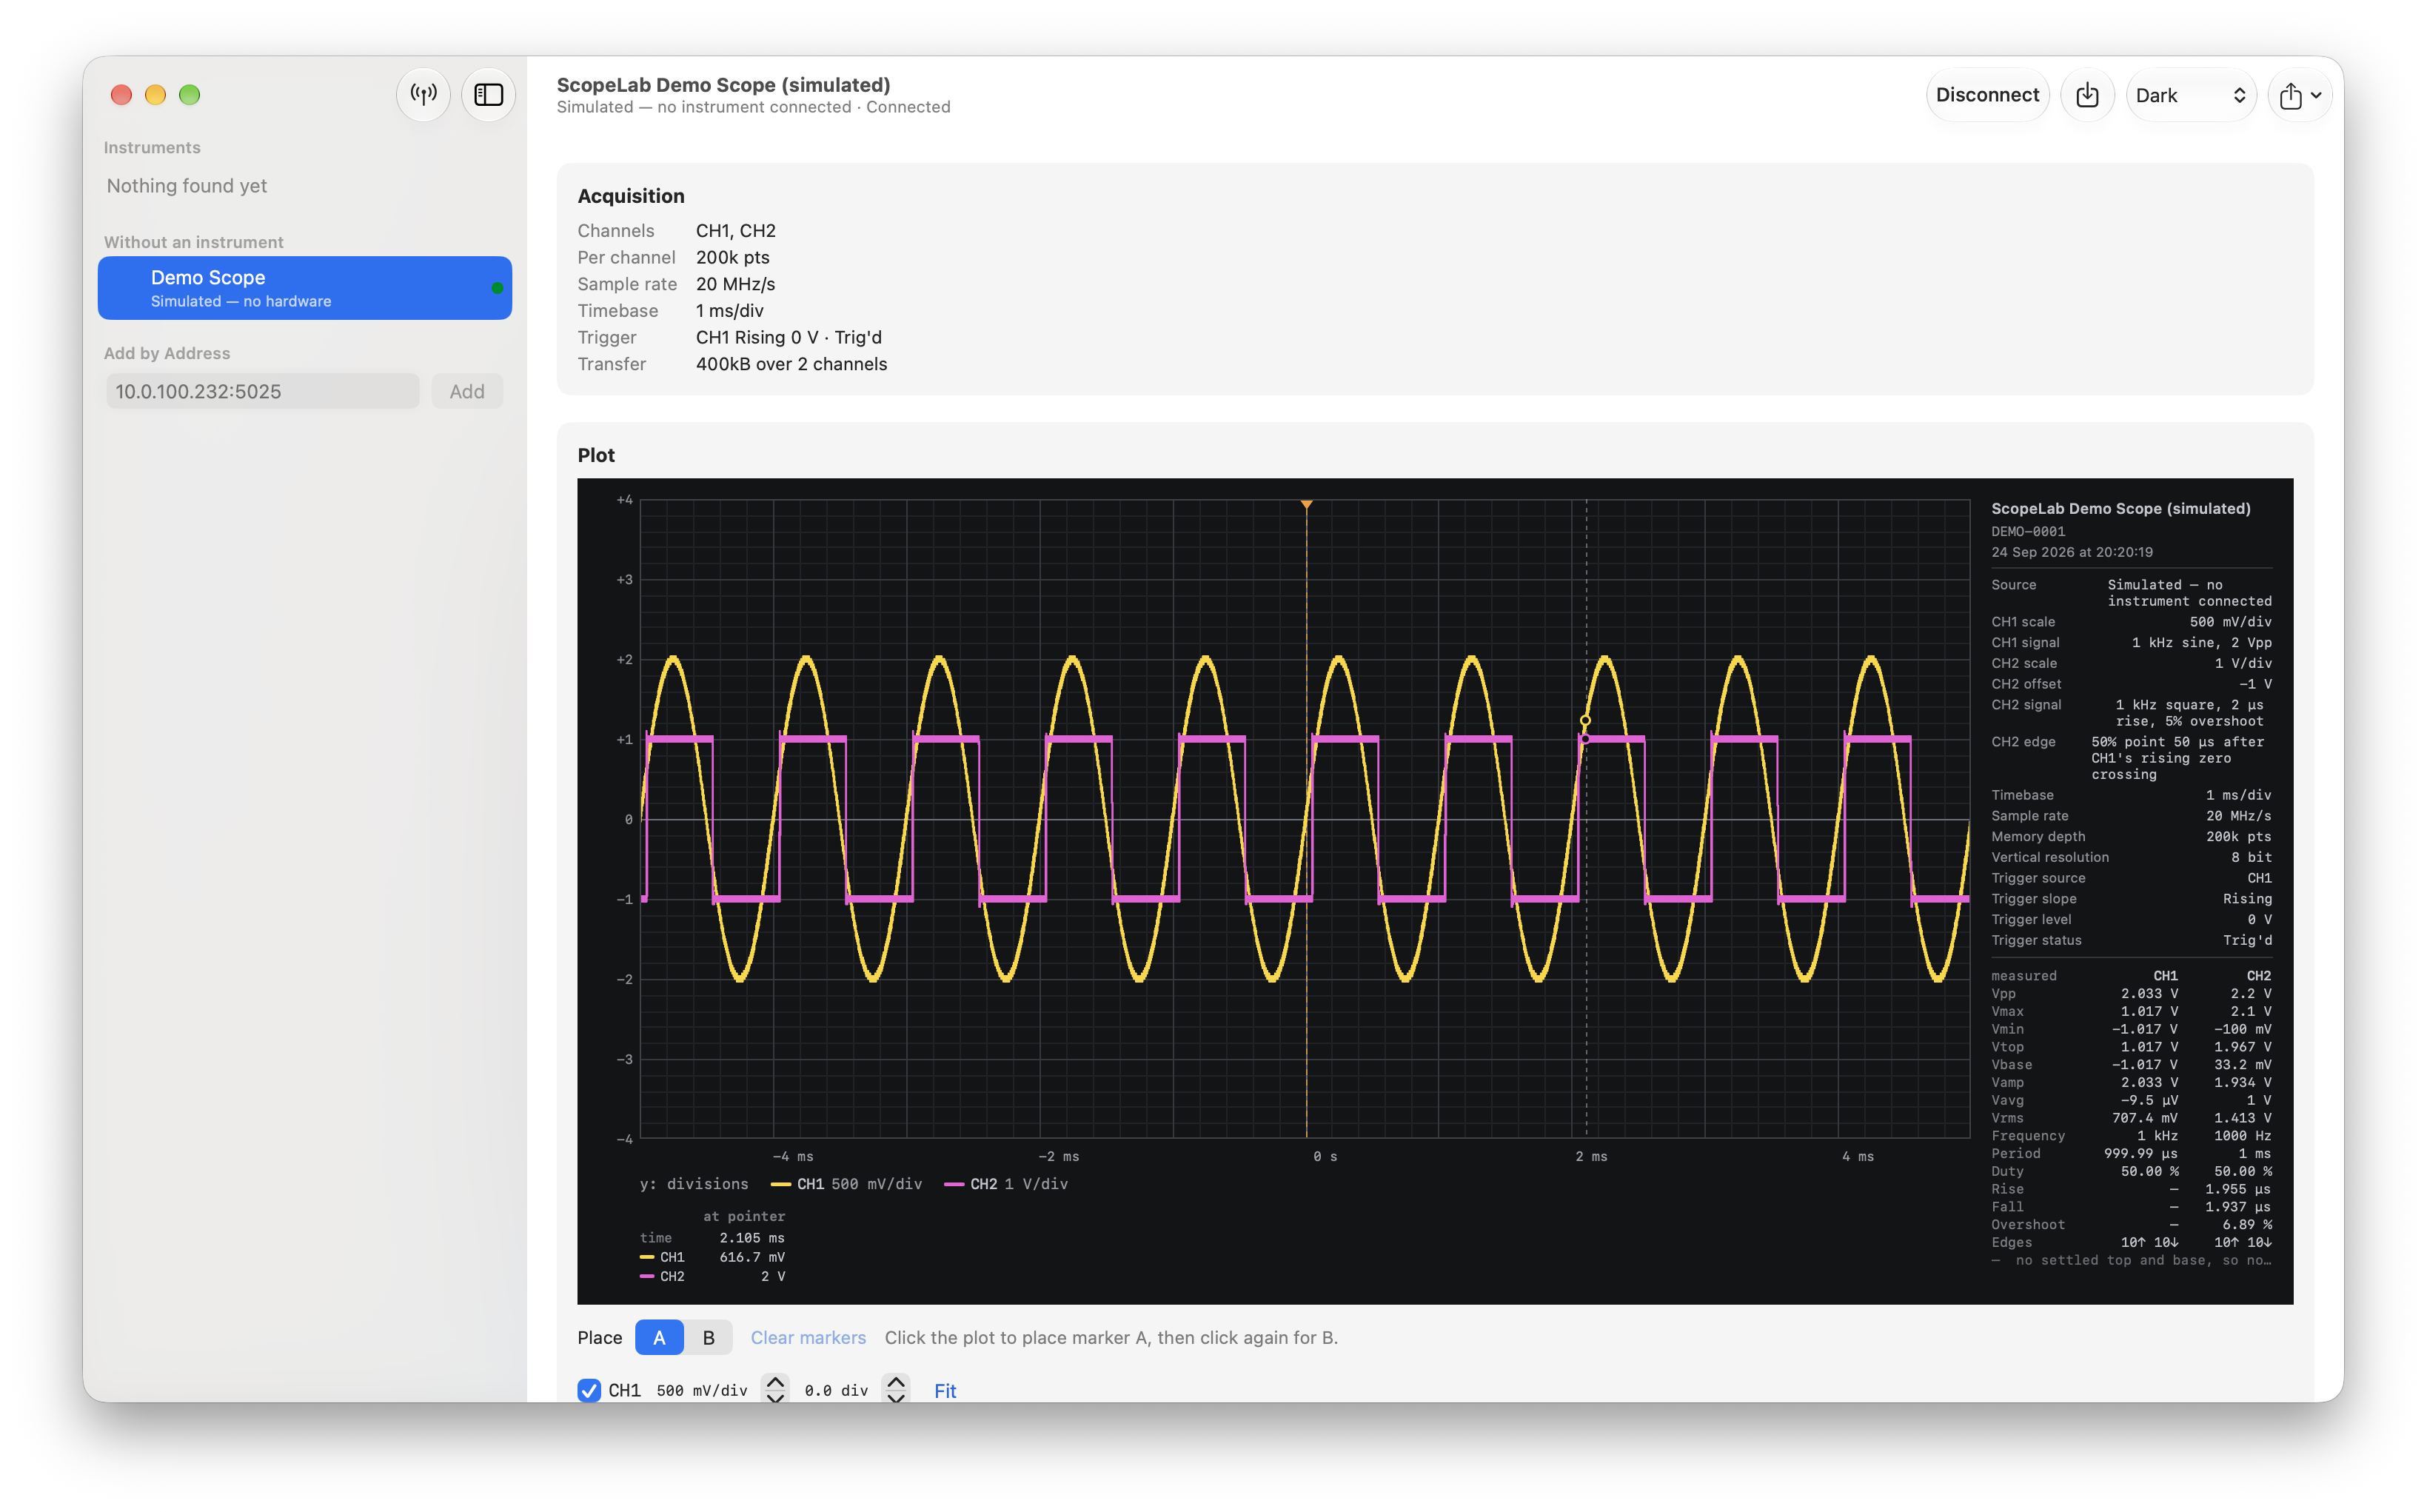
ScopeLab takes a different route. It pulls the actual sample array off the instrument — all two million points of it — and everything after that happens on your Mac. Cursors snap to real samples. Rise time, overshoot, duty cycle and the rest are computed from the data, so you get them whether or not your scope's own measurement package was an option on the price list. Plots export as vector PDF at any size, and the samples export as CSV alongside, so a figure in your report and the numbers behind it come from the same acquisition.
Captures save as a single document you can reopen months later, place new cursors on, and re-measure at different thresholds — with the instrument switched off and the bench torn down.
It is a native Mac app. It looks like one, it launches instantly, and it has no runtime, no Java, no vendor driver stack.
Features
Finds your instruments
- Automatic discovery on the local network — no addresses to type
- Manual entry by IP for instruments that don't announce themselves
- Ethernet (LXI/SCPI), USB (USBTMC) and USB GPIB
- Sandboxed and hardened: no kernel extensions, no drivers to install
Reads the real thing
- Full-depth acquisitions — two million points per channel, in seconds
- All four analogue channels, plus sixteen logic channels with a digital probe fitted
- Spectrum analyser sweeps, read and exported the same way
- Every trace carries the instrument's own settings, so a plot is a measurement rather than a picture
- The instrument's vertical scale and offset are honoured — the plot you get is the plot the scope was showing
Draws it properly
- Rendered from the samples at your display's resolution, not scaled up from the instrument's LCD
- Min/max envelope decimation: a single-sample glitch inside two million points still appears on screen
- Light, dark, and a document theme for printing — and exports look the same whatever the app's appearance
Measures from the data
- Vpp, RMS, mean, maximum, minimum, amplitude
- Top and base found by level histogram, so overshoot doesn't corrupt them
- Frequency, period, duty cycle, rise and fall time at 10/90% or 20/80%
- Overshoot, edge counts, and channel-to-channel delay
- Show the working — an overlay draws the levels and the crossings each number came from, so when a rise time looks wrong you can see why
- Two cursors that snap to real samples, never interpolating, with Δ and 1/Δt across every channel at once
Spectrum
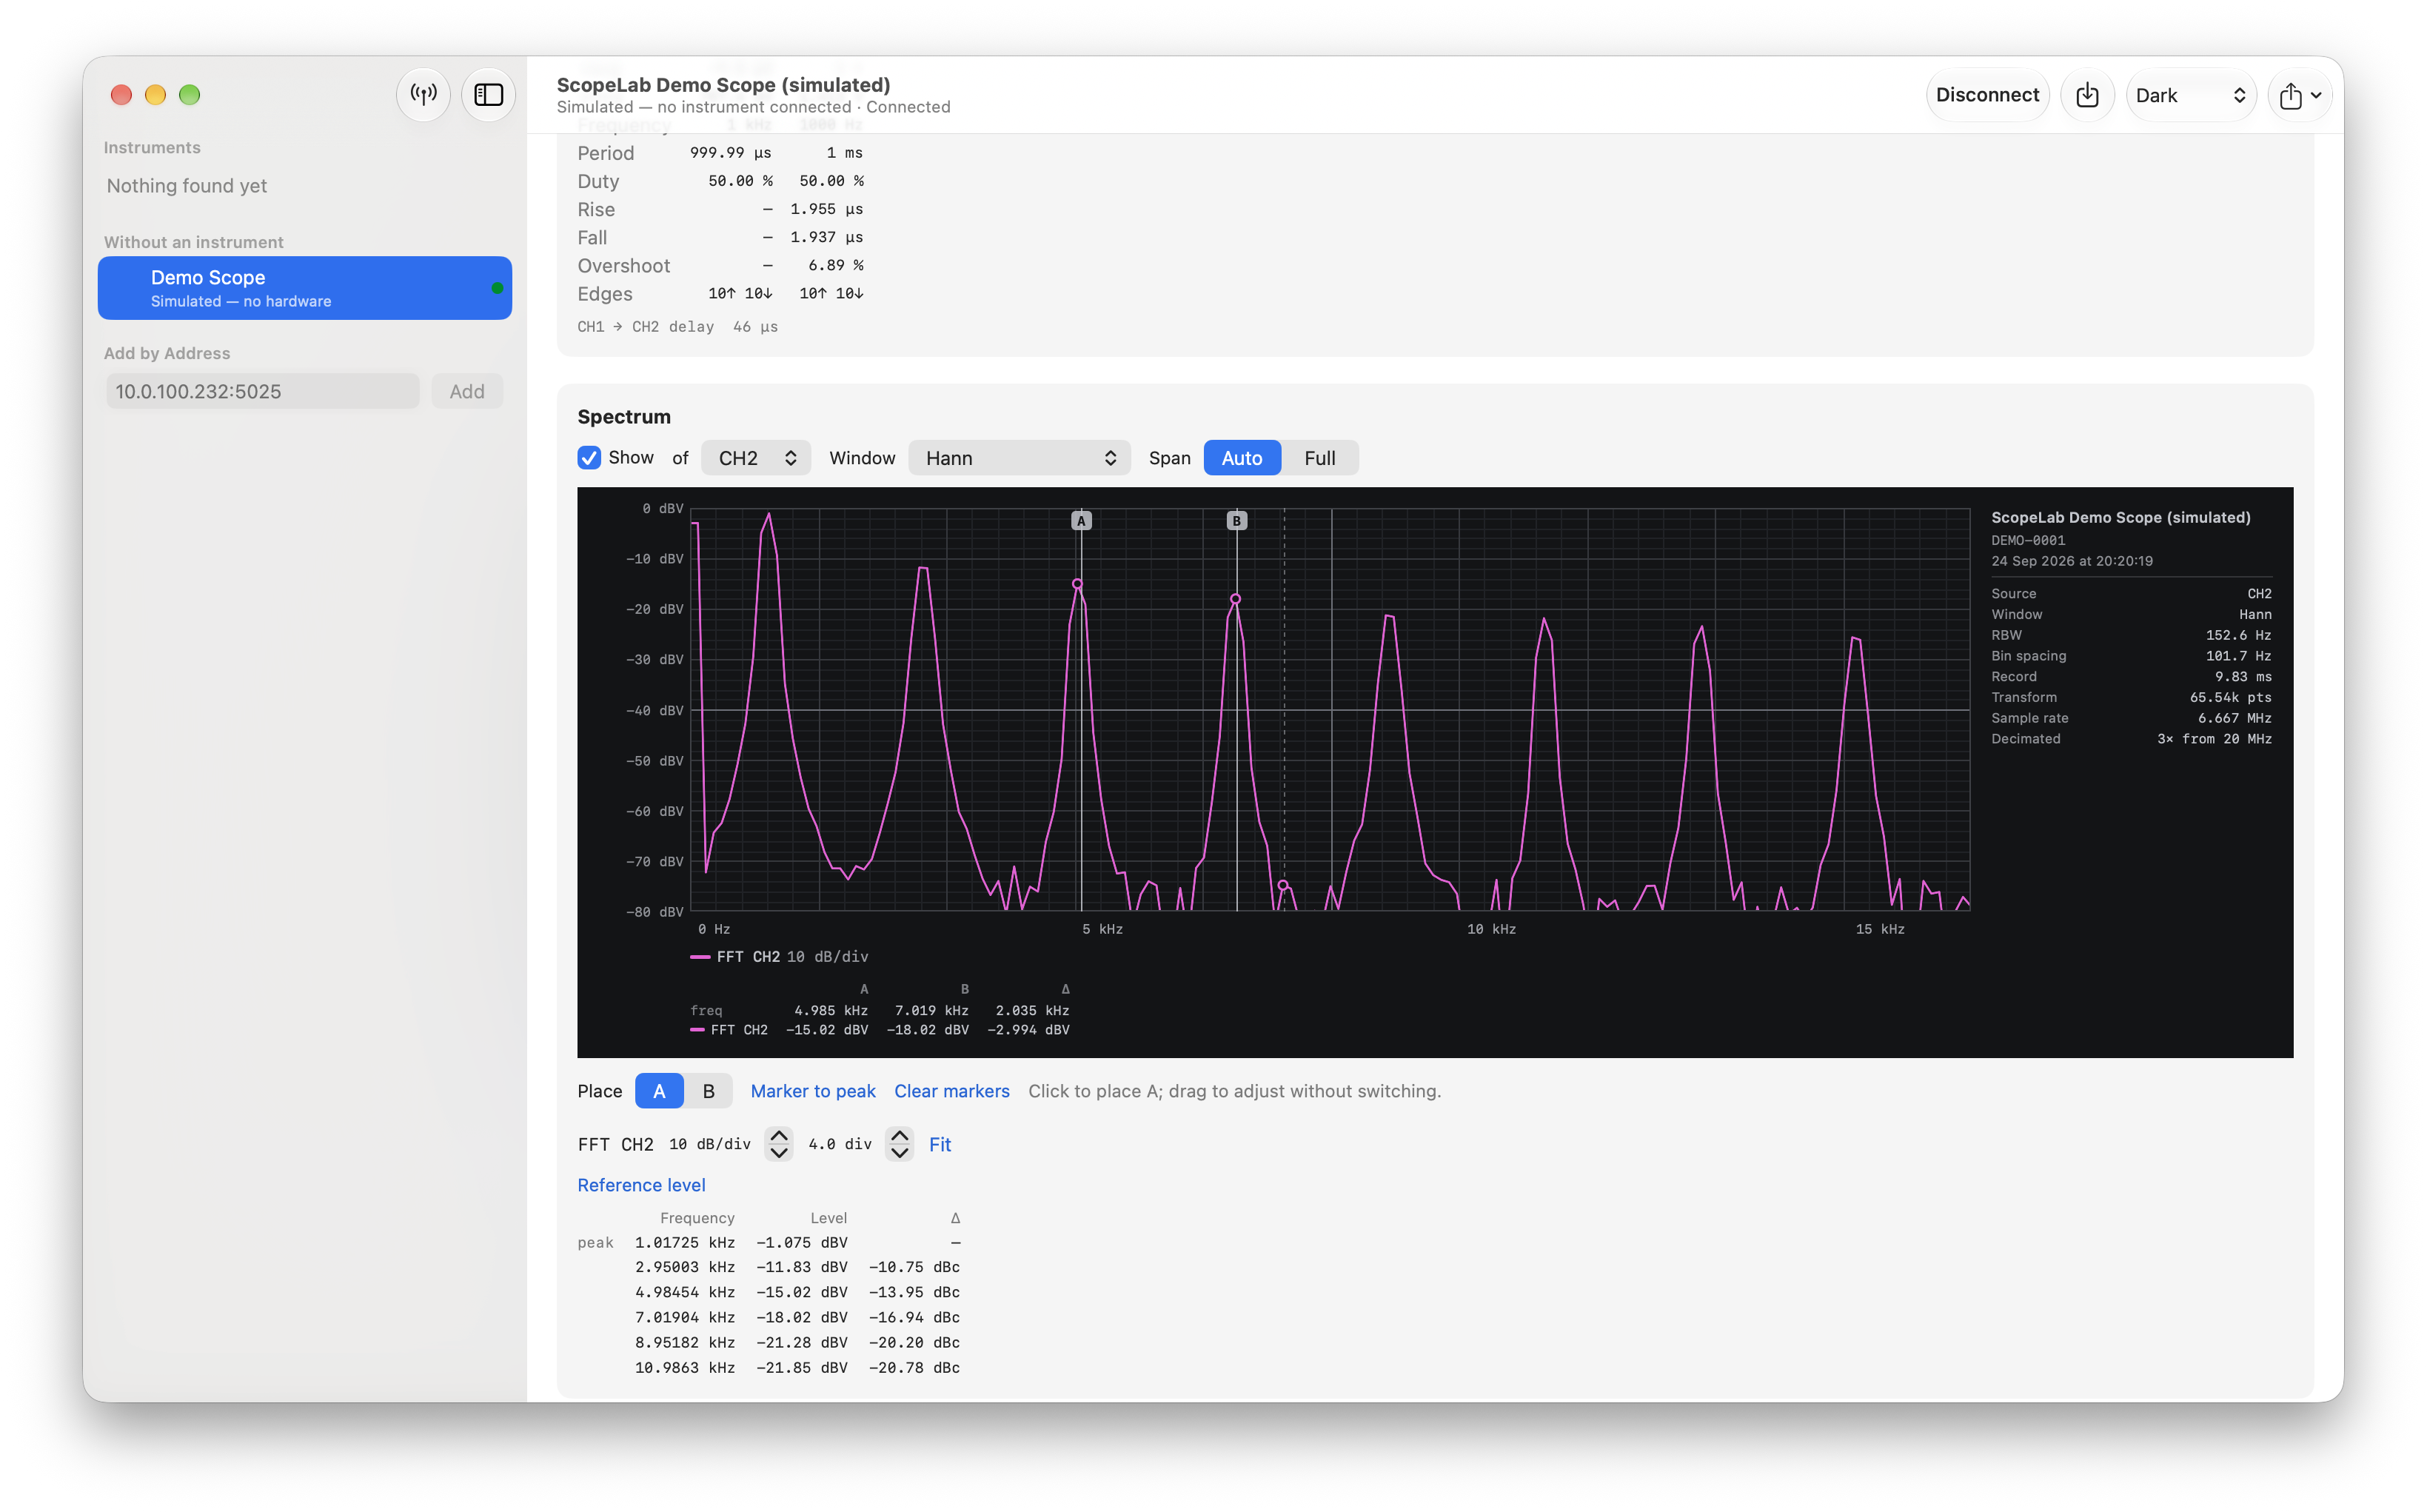
- FFT of any channel, on Accelerate, with selectable windows
- Resolution bandwidth quoted beside the trace — because a noise floor without it means nothing
- Peak table with automatic span framing
Gets data out
- Vector PDF — zoom into an edge in the exported file and the samples are still there
- PNG at any resolution
- CSV of the raw samples, with the acquisition settings in the header
- .scopelab documents: lossless, compressed (16 MB of samples in under half a megabyte), and re-measurable forever
Try it without an instrument
- A built-in simulated two-channel scope, so you can see the whole workflow before you unpack anything
TestFlight Beta
- Join the Apple TestFlight beta program by clicking on the icon below: